Rotation curve of the spiral galaxy NGC 3198 (van Albada et al. 1985)
|
|
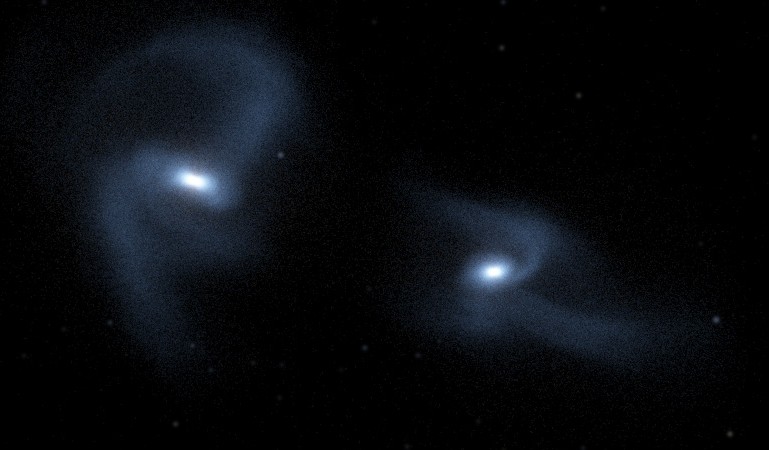
Local Group (van der Marel et al. 2012)
| Computer simulation of the predicted future collision of the two largest galaxies of the Local Group, Andromeda (M31) and the Milky Way. The prediction is based on measurements with the Hubble Space Telescope of the proper motion of M31 on the sky, along with the redshift of M31, yielding vradial = −109±4 km/s and vtransverse = 17±17 km/s. Visualization by F. Summers (STSci). |
|
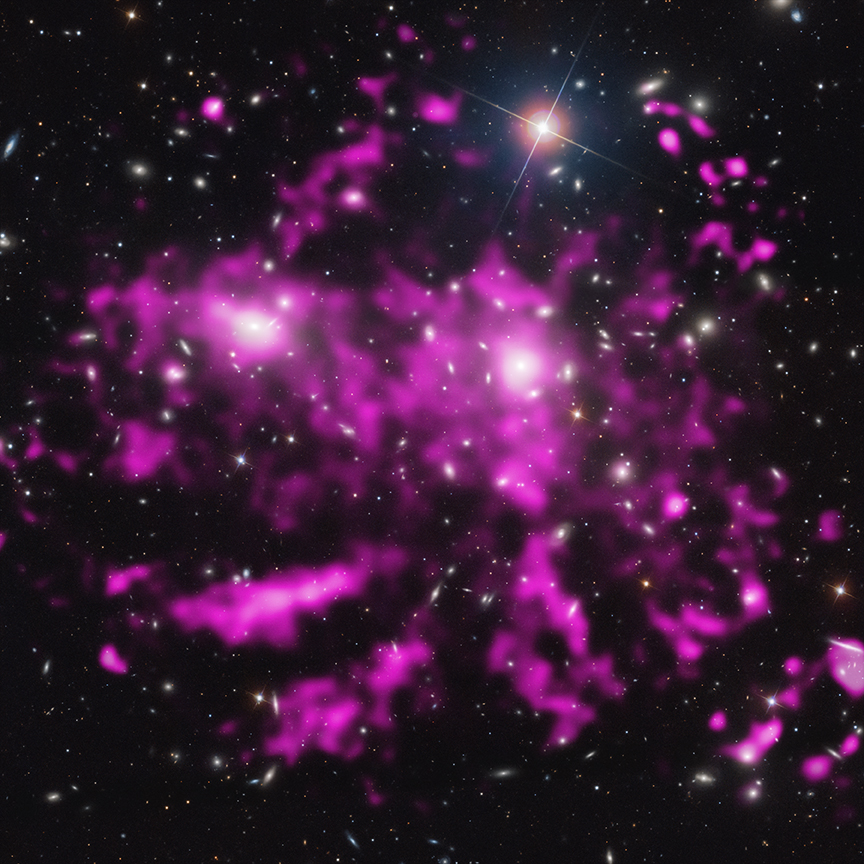
Coma Cluster (Abell 1656) (Sanders et al. 2013)
| Composite optical and x-ray (purple) image of the Coma cluster of galaxies. The Coma cluster at redshift 7,000 km/s is a rich cluster containing about a thousand galaxies. The x-rays trace smoothly distributed hot (~108K) gas that extends throughout the cluster. The x-ray image shown here has been enhanced to bring out variations in the emission. Most of the baryonic matter in the cluster is in the hot gas, not in the visible galaxies. The mass of the cluster can be estimated both from the velocity dispersion of the galaxies, and independently from the temperature of the x-ray emitting gas. As much as 90% of the mass is unobserved dark matter. (Chandra, XMM-Newton, Sloan Digital Sky Survey). |
|
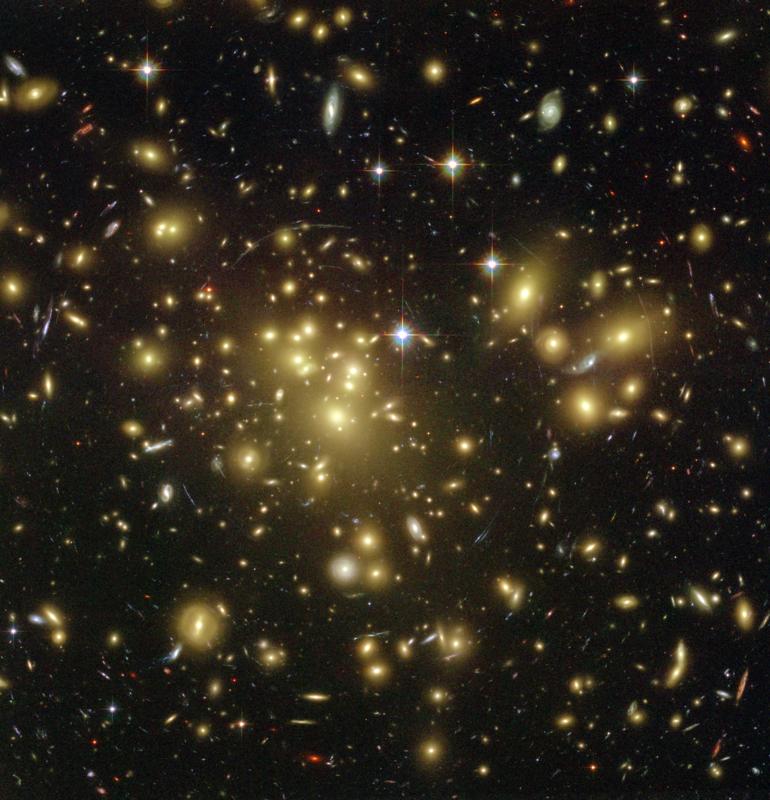
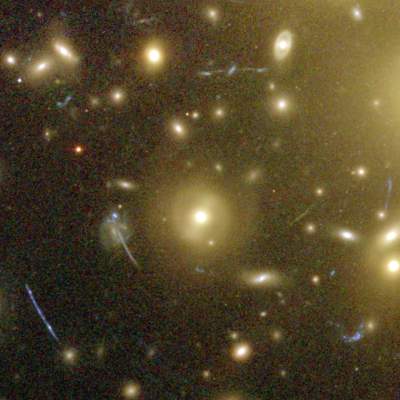
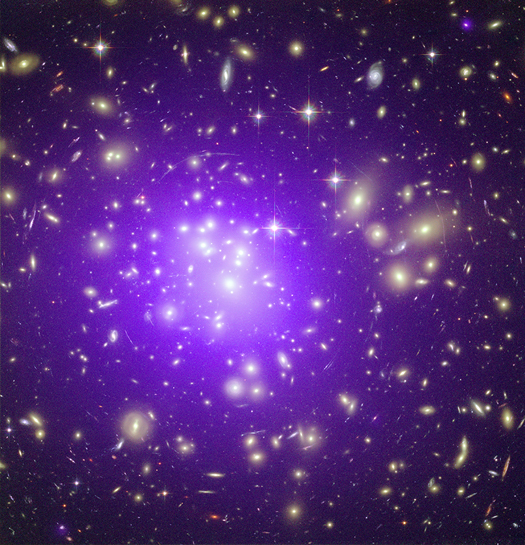
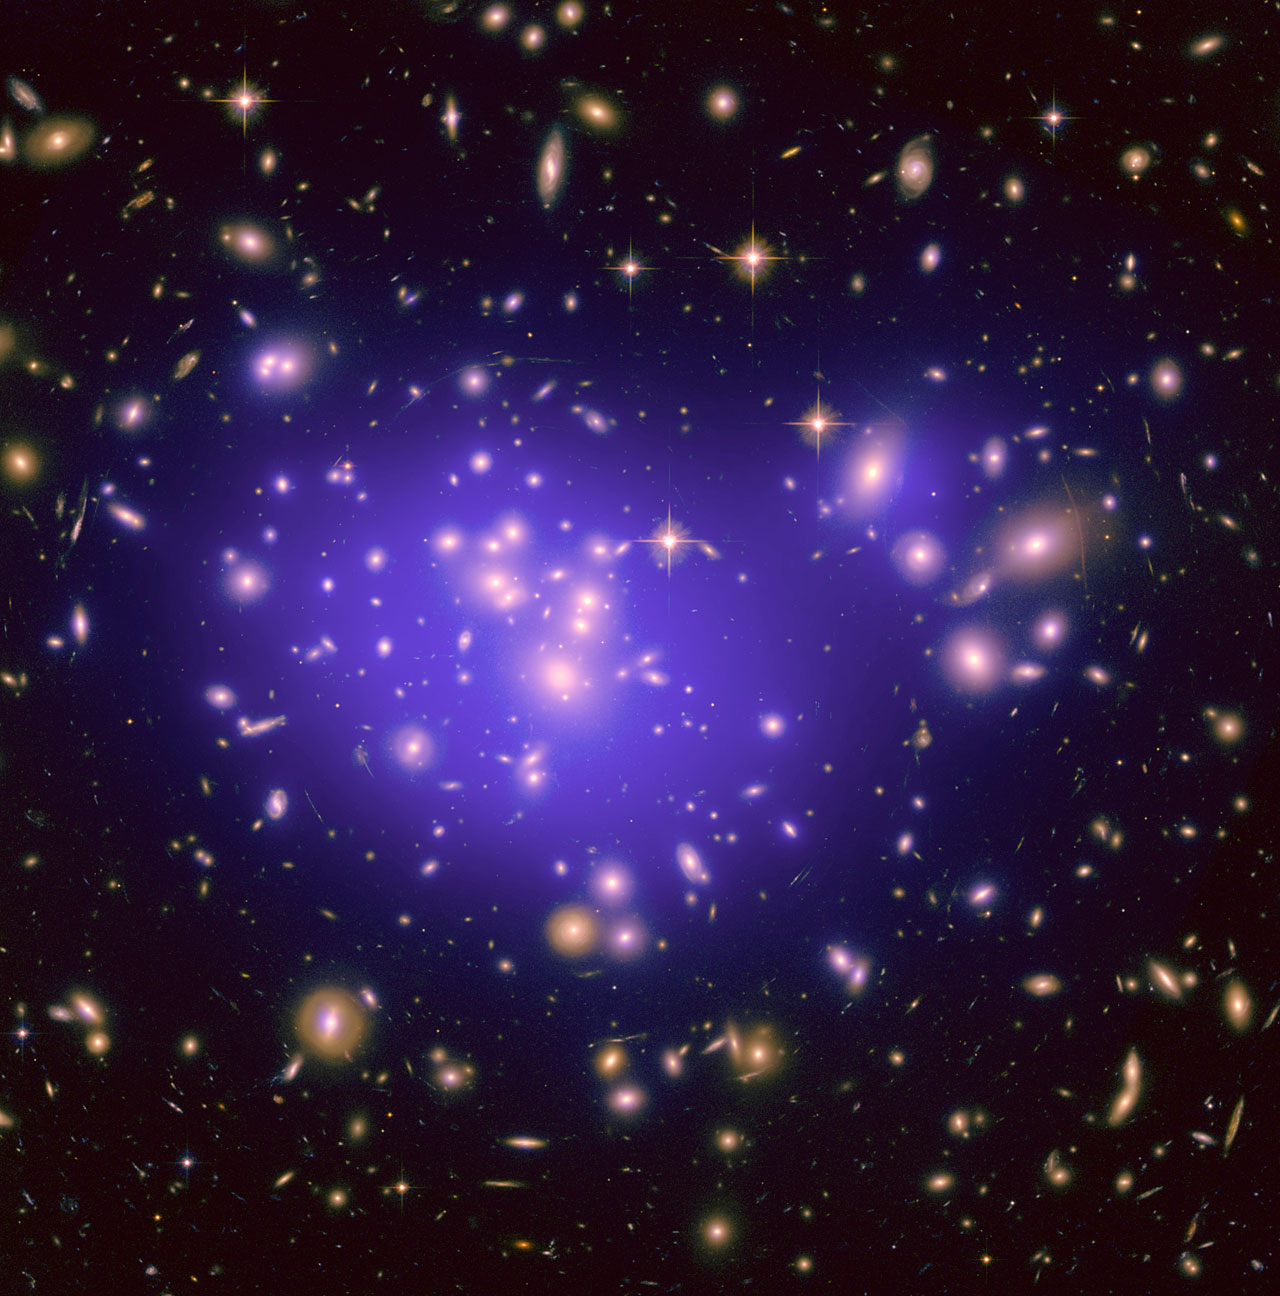
The rich galaxy cluster Abell 1689
| The rich galaxy gluster Abell 1689 at redshift z ≈ 0.2 gravitationally lenses distant galaxies behind it. The yellowish galaxies are those in the cluster itself, while the numerous bluish arcs are the gravitationally lensed background galaxies (Hubble Space Telescope). | ||
| ||
| ||
| ||
|
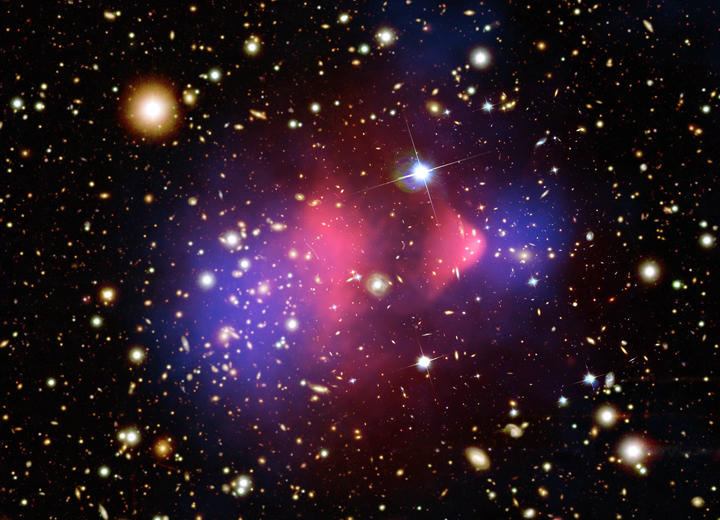
Bullet Cluster
| The blue haze shows dark matter mapped by gravitational lensing, while the red haze shows x-ray emission from hot gas in the galaxy cluster 1E 0657-56, nicknamed the Bullet Cluster (Image Credit: X-ray: NASA/CXC/M.Markevitch et al. Optical: NASA/STScI; Magellan/U.Arizona/D.Clowe et al. Lensing Map: NASA/STScI; ESO WFI; Magellan/U.Arizona/D.Clowe et al.). |
|
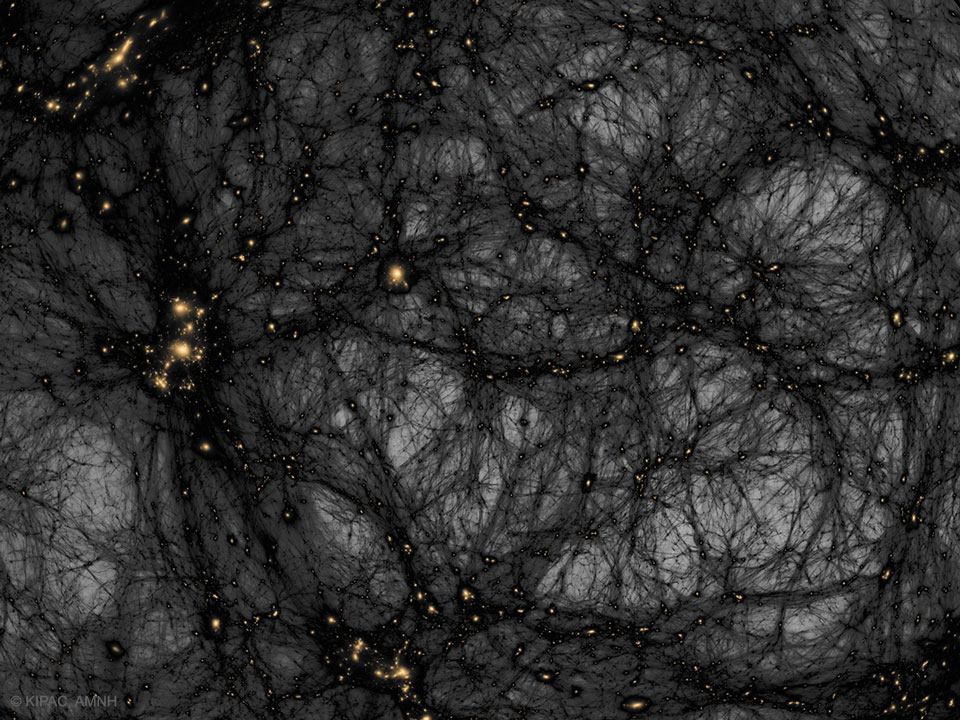
Dark Matter Simulation
APOD 2017 Oct 31
|
Illustris Simulations
|
APOD 2020 Feb 23
Dark matter on the left, morphing to gas on the right 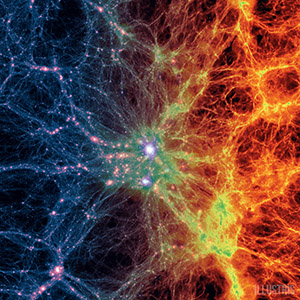
|
|
APOD 2019 Feb 26 Simulation of the formation of a galaxy cluster. |