5. SPIRAL ARMS:
Jan Oort, a Dutch Astronomer, was the first person (in the 1920s) to map the structure of spiral arms in the Milky Way. He did this by measuring the Doppler shifts of stars as a function of galactic longitude (the angle along the Milky Way measured counterclockwise from the galactic center) and distance from the Sun. As we have already mentioned, this technique can be done much better by measuring the velocity of hydrogen gas in the Milky Way with radio telescopes. Hydrogen atoms emit and absorb radiation in a famous spectral line known as the 21-cm line. Unlike starlight, radio waves are not absorbed in the dark interstellar dust clouds that pervade the disk of the Milky Way. Therefore, astronomers can see the 21-cm line from hydrogen gas in the Milky Way at much greater distances than they can observe stars.
Since the Milky Way is in differential rotation (i.e., the inner parts are rotating faster than the outer parts), we see a pattern of Doppler shifts of spectral lines from the gas in the galactic plane that depends on which direction in the Milky Way we are looking and how far the gas is from us. We can use Oort's technique to map the locations of dense gas clouds of interstellar gas in the Milky Way. As we shall discuss in the next lesson, we can see radio spectral lines emitted by carbon monoxide (CO) molecules in such clouds. Below is a map from Harvard University showing the intensity and Doppler shifts of CO emission from gas in the Milky Way.
The upper panel represents the total intensity of emission from CO in any direction. The horizontal axis represents longitude angle around the Milky Way, while the vertical axis represents latitude angle above or below the Milky Way. You can see that the radio emission from CO molecules is highly concentrated toward the Milky Way. (The upper panel in fact represents the same data as the panel marked "molecular hydrogen" in the Multiwavelength Milky Way.) The lower panel represents something different, however. The horizontal axis is the same, but the vertical axis now represents velocity, with blue-shift indicated by the curve being below the central line and red-shift, being above. In this plot, the emission to the left of the center of the galaxy is all redshifted. You can see that at any given angle there is emission from several redshifts and that it is not smooth. That is the case because the CO-emitting gas is not uniformly distributed through the Milky Way but is concentrated in clouds (star-forming regions). The velocity of the redshift corresponds to distance of the cloud, which we can infer from the known differential rotation of the Milky Way.
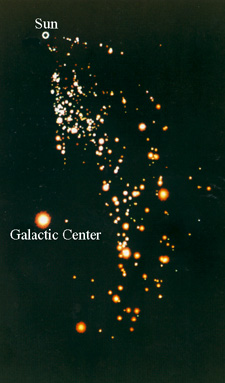 Our
understanding of the relationship between red shifts and blue shifts with distance
in the Milky Way enables us to do something wonderful: we can use this knowledge
to make a top-view map of the Milky Way to see where the molecular clouds lie.
The result is illustrated on the left for the first quadrant. You can also see
that the molecular clouds are not scattered randomly, but are mostly concentrated
in three arcs (to see these arcs it may help to squint). These arcs are parts
of the spiral arms of the Milky Way. With radio telescopes, we can trace these
spiral arms all the way through the Milky Way, most of which is totally obscured
by dark clouds in optical light. Pictures like this make it fun to be a scientist.
Without understanding the Doppler shift, we would have no way to see the Milky
Way from this perspective. Only God, or intelligent beings on some distant galaxy,
would have such a view. If God exists, it was very nice of him or her to give
us the brain power so that we can share this excellent view!
Our
understanding of the relationship between red shifts and blue shifts with distance
in the Milky Way enables us to do something wonderful: we can use this knowledge
to make a top-view map of the Milky Way to see where the molecular clouds lie.
The result is illustrated on the left for the first quadrant. You can also see
that the molecular clouds are not scattered randomly, but are mostly concentrated
in three arcs (to see these arcs it may help to squint). These arcs are parts
of the spiral arms of the Milky Way. With radio telescopes, we can trace these
spiral arms all the way through the Milky Way, most of which is totally obscured
by dark clouds in optical light. Pictures like this make it fun to be a scientist.
Without understanding the Doppler shift, we would have no way to see the Milky
Way from this perspective. Only God, or intelligent beings on some distant galaxy,
would have such a view. If God exists, it was very nice of him or her to give
us the brain power so that we can share this excellent view!
Why does the Milky Way have spiral arms? The most important point to remember here is that the spiral arms are defined by the star-forming regions: dense molecular clouds and massive young stars. The spiral structure would not be nearly so obvious in a picture of the Milky Way taken in infrared light, which favors old stars like the Sun and red giants. But, since massive stars produce light all out of proportion to their mass, they highlight the spiral arms.
The other crucial point to remember is that the Sun has passed in and out of spiral arms many times in the 4.6 billion years since it was born, as illustrated below. The Sun takes about 250 million years to make one full circuit around the Milky Way, and in that time it will orbit from one spiral arm to another. But not the massive stars: with lifetimes of less than 50 million years, they don't live long enough to move out of the spiral arms where they are born.
|
|
The figure above illustrates why the Milky Way (and other galaxies) have spiral arms. The stars and gas have elliptical orbits around the center of the galaxy, and the directions of the long axes of the ellipses progress (clockwise in the above diagram) with increasing distance from the center of the galaxy. As a result, a higher density of stars and gas is found in spiral patterns where the orbits crowd together.
The spiral arms are density waves. Like waves in the ocean, they travel through the fluid (of stars and gas), not with it. (A boat in the ocean will bob up and down as a wave passes under it, but it will not be carried with the wave.) You can think of the star-forming regions, with their luminous blue stars and glowing gas clouds, as "white-caps" of these density waves.
The density wave theory is also discussed in Spiral Arms by Nick Strobel, which mentions another idea to explain spiral arms: self-propagating star formation. The idea is that supernovae can compress interstellar gas, causing new star formation. When this process is combined with the differential rotation of the galaxy, spiral patterns of young stars tend to appear.
(Return
to course home page)
Last modified March 3, 2002
Copyright by Richard McCray