6. SUPERNOVA 1987A
On the evening of February 23, 1987, a young Canadian astronomer
named Ian Shelton walked outside of the dome at the Cerro Tololo InterAmerican
Observatory and took a photo of a nearby galaxy, the Large Magellanic Cloud
(LMC) with his Nikon Camera. Shelton developed the photo
and immediately noticed a bright star where none had been seen before. He told
his colleagues, and within hours the word had sped around the world, by phone,
e-mail and fax. This was a nearby supernova -- the brightest one to be seen
since 1604 AD, when Johannes Kepler observed a supernova in our own galaxy.
|
|
|
Supernova 1987A before and after the explosion. The arrow in the
panel on the right points at the blue giant parent of the supernova
before it blew up. The panel on the left shows the supernova about 2
months after the explosion. Copyright by Anglo-Australian
Observatory.
|
Astronomers immediately began to observe the supernova
(called SN1987A) with every telescope they could use. Unfortunately, the great
telescopes in Hawaii and the Northern hemisphere could not observe the supernova
because it was far to the south. But astronomers could observe it almost continually
with telescopes in Chile, Australia, and South Africa. In this image
of the LMC, you will see a big bright nebula of glowing
hydrogen gas in the upper left, called 30 Doradus or the Tarantula Nebula. In
this magnified image of the Tarantula
Nebula with SN1987A you can see the supernova to the
lower right. In the pair of images at the top of this page, the arrow on the
right panel points to the star that blew up. Before it blew up, it was already
a fairly luminous (about 105 times the Sun) blue star; but after
the explosion it suddenly became 1000 times brighter (about 108 times
the Sun), as seen on the left panel.
From its location in the LMC, the light from SN1987A must travel
for about 160,000 years before it reaches the Earth. So, when Ian Shelton first
saw the supernova explode in 1987, he saw an event that had actually occurred
in about 158,013 BC (1987 - 160,000 years). Today, in 2002, we are seeing a
delayed-action re-run of the actual event. When we say that SN1987A is 15 years
old, we really mean that it is 15 years older than when we first saw it.
Neutrino observations: Actually,
there were two "observatories" in the Northern hemisphere that did observe SN1987A.
They were huge tanks of water deep underground, all sides of which were covered
with instruments designed to detect flashes of light that might occur in the
water due to the interactions of fundamental particles. One, called the Kamiokande
experiment, was in Japan; and the other, called the IMB experiment, was in Ohio
(deep under Lake Erie). These experiments were designed to detect rare proton
decay events predicted by theories of elementary particles, and the builders
had no idea that they might detect neutrinos from supernova explosions. The
neutrinos from SN1987A came right through the Earth and entered these tanks
of water from beneath. A very few of them (12 in the Kamiokande detector and
8 in the IMB detector) interacted with atomic nuclei (protons) in the water
to make very fast positrons, which in turn made light flashes in the water that
the experiments detected. You can see the results here.
From these observations, scientists were able to infer three properties of the
neutrino burst: (1) the total energy (about 0.1MSunc2,
or 1/10 the mass-energy equivalent of the Sun); (2) the temperature of the neutrino
source (40 billion K); and (3) the duration of the neutrino signal (about 10
seconds). All these values were just what scientists expected from theoretical
calculations of the collapse of the core of a star to form a neutron star. So
these observations of neutrinos from SN1987A provided very strong evidence that
the supernova explosion was accompanied by the formation of a neutron star,
as illustrated here.
Despite this evidence, and twelve years of intensive observations,
nobody has found any further evidence of a neutron star at the center of the
debris of SN1987A. Why? We don't know.
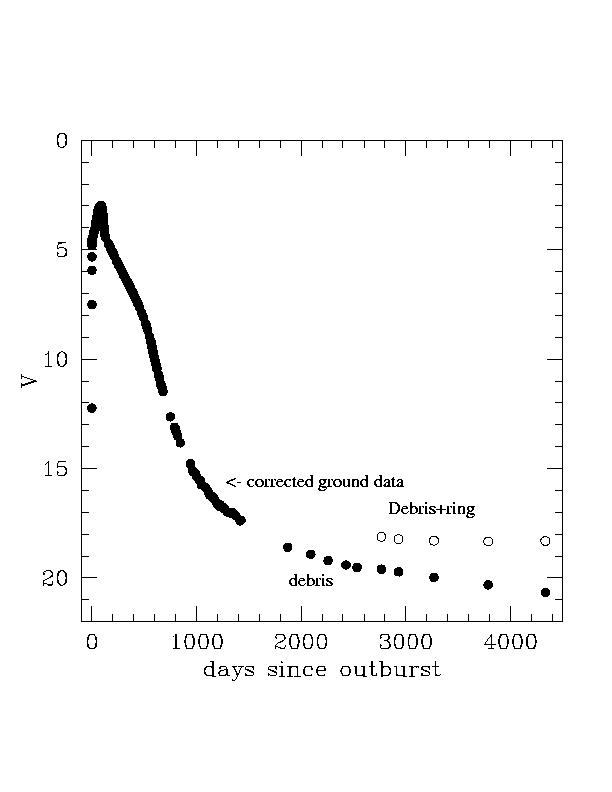
Optical light and gamma rays:
The graph below shows a record of the optical light curve of SN1987A for the
first 1400 days after the explosion was first observed. The crosses are the
actual data. The graph shows that the supernova

continued to brighten for the first 100 days after the initial
flash, reaching a maximum brightness of about 3rd magnitude, bright enough to
see with the naked eye. But then it faded rapidly, with the brightness dropping
by a factor of 2 every 77 days for the first 500 days, as indicated by the dashed
line.
The light from SN1987A faded at almost exactly the same rate observed
in laboratories for the decay of the radioactive nucleus Cobalt-56 into the
stable nucleus Iron-56 (the half-life
of Cobalt-56 is 77 days). This was not a great surprise, because astronomers
had long suspected that supernova explosions were responsible for the formation
of the heavy elements in the universe. Theoretical calculations of the formation
of heavy nuclei at billions of degrees (the temperature expected during the
explosion) indicated that about this much Cobalt-56 would be formed. But the
fact that the supernova light decayed just as expected was the strongest confirmation
to date of the idea that supernova explosions really did make the heavy elements
-- and, for the first time, we could measure exactly how much Cobalt-56 was
made (0.07 Solar masses).
After 500 days the visible light faded even faster than the
Cobalt-56 decay rate. That happened because after that time dust particles began
to form in the supernova debris. The grains absorbed part of the optical radiation
and converted it into infrared radiation. Moreover, the supernova debris had
thinned out enough so that the gamma rays could escape directly without first
becoming converted to optical light. In fact, gamma ray telescopes in space
could observe these gamma ray photons, and they saw that the gamma ray photons
had exactly the same energy as those produced by Cobalt-56 in laboratories on
Earth. That clinched the idea that the supernova explosion made Cobalt-56. Think
about it: the iron that makes your blood red was once radioactive Cobalt-56.
It was produced in a supernova explosion several billions of years ago. The
observations of gamma rays from SN1987A leave little doubt about that. The same
with the oxygen you breathe, the calcium in your bones, and the earth you stand
on. We are, literally, stardust. In fact, we might consider ourselves the consciences
of supernovae: the creatures supernovae have created to worry about the consequences
of their unruly outbursts. The optical light of SN1987A has continued to fade
for the past 15 years, and now has visual magnitude about mV = 21.
(See Lightcurve.) The radioactive heating by Cobalt-56
has long since become negligible. We believe that the main radioactive energy
source today is Titanium-44, which decays much more slowly (with a half-life
of 54 years).
Spectrum evolution: The graph
below shows the optical spectrum of SN1987A at three dates after outburst.
The top panel shows the spectrum on February 25, 1987, two
days after outburst. You can see that the spectrum has a strong continuum that
is rising at short wavelengths, punctuated by very broad emission and absorption
lines of hydrogen and helium. This spectrum is very similar to that of a hot
blue star (spectral type O). The broad absorption lines are caused by rapidly
expanding gas above the photosphere; they are blue-shifted because we see the
near side of the supernova, which is expanding toward us. We can measure the
expansion velocity of the supernova debris from the blue shifts of these absorption
lines. At early times, the measurements showed that the outer part of the debris
was expanding with velocity 30,000 km/s, or 10% of the speed of light! The spectrum
changed very rapidly. Seven weeks after outburst (middle panel), the photosphere
had cooled to a temperature of about 3000 K (spectral type M). The spectral
lines were considerably narrower. One might think that this result implied that
the supernova expansion had slowed down, but that would be a mistake. Actually,
the fastest moving gas had become so thin that it was invisible, so we were
now seeing spectral lines produced by atoms in more slowly expanding gas deeper
inside the supernova.
Six months after the explosion (bottom panel), the continuum was
almost completely gone from the spectrum, which was now dominated by emission
lines. This kind of spectrum is called a nebular
spectrum, because it resembles that of a gaseous nebula,
such as the Orion Nebula. As the name suggests, the expanding debris of the
supernova has now become so thin that one can see right through it.
Today, 15 years after the explosion, we see that the spectrum
of SN1987A is still dominated by emission lines. By analyzing these lines, we
find that the supernova debris has cooled to less than 300 K. In fact, SN1987A
is the coolest optically emitting object in the sky. The debris is far too cool
to emit optical radiation, and certainly would be invisible but for the fact
that it contains radioactive elements such as Titanium-44. In 15 years, we have
seen the debris of SN1987A cool from one of the hottest places in the universe
(T > 1010 K) to one of the cooler places (T < 300 K).
The mystery of the circumstellar rings.
A few months after SN1987A went off, a small telescope on the International
Ultraviolet Explorer (IUE) satellite observed that narrow emission lines began
to appear in its ultraviolet spectrum. This was a surprise: the supernova debris
was expanding with velocities of thousands of kilometers per second; yet, the
ultraviolet emission lines were narrow, indicating expansion velocities of less
than 10 km/s. The ultraviolet emission lines continued to brighten, reaching
maximum brightness 400 days after outburst, and then began to fade.
Astronomers soon figured out that these emission lines couldn't
be produced by the supernova itself. The emitting gas was moving far too slowly.
Instead, they must be produced by gas nearby the supernova, which began to glow
after being illuminated by the flash of ultraviolet and X-ray light from the
supernova outburst. But what was this gas? The telescope on IUE did not have
sufficient angular resolution to obtain an image.
|

|
|
The triple-ring system of gas around SN1987A. The small spot at
the center is the radioactive debris of the supernova. The two bright
stars are not part of the system -- they just happen to lie in the same
direction. Source: Hubble
Space Telescope Information Service.
|
Several years later, the Hubble Space Telescope obtained the
image of SN1987A shown above. The supernova was surrounded by a remarkable system
of three rings of glowing gas! Where did these rings come from? They must be
related to the supernova because the supernova is at their center. But they
could not have been ejected by the supernova explosion. In fact, if one divides
the radius of the inner ring (6 x 10¹² km, or 0.6 light-years) by
the expansion speed (10 km/s, or 1/30,000 times the speed of light), one finds
that the inner ring must have been expanding for 20,000 years to grow to this
radius. Thus, the inner ring must have been ejected 20,000 years before the
supernova explosion.
This movie
illustrates the actual three-dimensional shape of the triple-ring system. If
this gas was ejected by the star, why does it have this remarkable structure?
Astronomers really don't know -- this triple ring system is one of the outstanding
mysteries of SN1987A. Some physical effect must determine the polar axis of
the rings. We suspect rotation. But rotation of what? Many astronomers now believe
that the parent star of SN1987A was actually a close binary system. Perhaps
the inner ring was ejected while the merger took place, 20,000 years before
the explosion, as illustrated below.
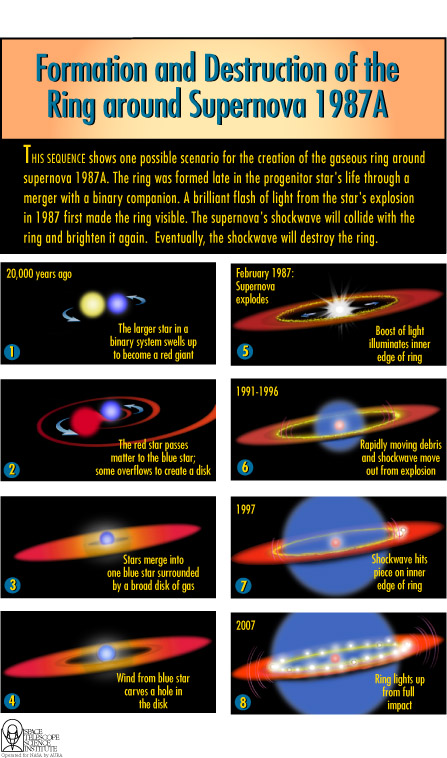
There is one other reason to suspect that the parent star of
SN1987A was a merged binary system. Astronomers actually had taken a picture
and a spectrum of the parent star before it exploded, and they could see that
it was a blue giant star, not a red giant as expected for a star that was about
to become a supernova. Perhaps the same merger event that caused the ejection
of the rings would expel the distended outer atmosphere of the red giant star,
leaving a hot blue core behind. We now think that the time variation of the
ultraviolet emission lines seen by the IUE satellite is the result of illumination
of the inner ring by the initial X-ray flash of the supernova. More than that,
we can infer the physical diameter of the ring by analyzing the variation of
ultraviolet narrow emission lines observed by IUE. By comparing the physical
diameter to the angular diameter of the ring seen in the Hubble Space Telescope
Image, we can infer the distance to the supernova. Finally, by dividing the
radius of the ring by the expansion speed of the supernova debris, we can estimate
when the debris will hit the inner ring.
The answer is: today! This is exciting, because we have never before seen
a crash like this. I and my students and colleagues have been working for several
years to predict what we will see when the crash occurs and what we will learn
from such observations. We predict that the ring will become hundreds of times
brighter than it is today at optical wavelengths. It will also become very bright
in the radio, infrared, ultraviolet, and X-ray bands of the electromagnetic
spectrum. That's great, because astronomers are now building telescopes that
can observe SN1987A in these bands with unprecedented sensitivity, angular resolution,
and spectral resolution. The Hubble Space Telescope is the telescope of choice
at optical and ultraviolet wavelengths. In 1999, NASA launched the Chandra X-ray
telescope, and SN1987A was one of the first targets it observed. Before long,
we'll be able to observe SN1987A at infrared wavelengths with NASA's SIRTF telescope.
In about a decade from now, we'll get a much better picture at radio wavelengths
with the Atacama Large Millimeter Array.
We simulated the impact of the supernova debris with the inner
ring by solving the equations of gas dynamics on a supercomputer. We assumed
that the ring was a torus (i.e., shaped like a donut). Click here
to see the results (courtesy of John Blondin of North Carolina State University).
In this simulation the yellow circle represents a cross-section cut through
part of the ring and the supernova is off to the left. The blast wave from the
supernova enters the ring 12.7 years after the explosion, or AD2000. It compresses
the gas to high density and high temperature (shown as red). It continues to
crush and shred the ring, until about 30 years after the explosion, when the
ring is totally destroyed. Once we know the temperature and density of the shocked
gas, we can calculate the intensity and spectrum of the radiation it emits in
the optical, infrared, ultraviolet, and X-ray bands. With such calculations,
we predicted that the ring will brighten by a factor of several hundreds after
the impact occurs.
In 1997, I wrote on this page:
|
"We don't yet know exactly when this impact will occur,
however, because there must be some gas between the supernova and the
ring, and the fastest-moving supernova debris will slow down somewhat
as it sweeps up this gas. The gas has such low density that we can't
see it optically, but we can see it in X-rays. Here's an X-ray
image of SN1987A taken with the NASA-Germany
ROSAT satellite. The X-rays come from gas compressed and heated to more
than 10 million degrees as a result of the impact of the supernova debris
with the low-density gas between the supernova and the ring. This X-ray
flux from SN1987A was first detected in 1991 and has been increasing
steadily since then, as the supernova debris compresses and heats more
and more of this gas.
"In this image, SN1987A is blurred to a spot that is
bigger than the inner ring, so we can't tell how close the X-ray emitting
region is to the inner ring. But astronomers at the Australia Telescope
National Facility also detected radio emission from SN1987A at about
the same time that the X-ray emission appeared, and that array of radio
telescopes had better angular resolution than ROSAT. Here is their radio
image of SN1987A, shown as green contour lines
superimposed on the (red/orange) optical image from the Hubble Space
Telescope. Evidently, the source of the radio emission lies between
the glowing radioactive debris of the supernova at the center of the
ring and the ring itself. We expect that the X-ray emission comes from
the same place. That is the place where the most rapidly moving debris
of the supernova is crashing into gas between the supernova and the
ring. The gas in this impact region is invisible optically because its
density is too low and its temperature is too high; but we can see it
in X-rays and radio emission.
"When my colleagues and I developed a theoretical model
to explain the X-ray emission, we also calculated the intensity of ultraviolet
emission from the impact region. We discovered to our great delight
that this ultraviolet emission should be bright enough to observe with
the Hubble Space Telescope, so we wrote a paper that was published this
February (1997) predicting that the HST would see it."
|
Today, all these predictions are coming true. With the Hubble
Space Telescope (HST) we are seeing ultraviolet and optical emission from the
fast-moving debris of the supernova. Below is a spectrum from the Space Telescope
Imaging Spectrograph showing hydrogen gas from the supernova debris moving at
a velocity of 1/20 the speed of light. The hydrogen emits ultraviolet line radiation
when it is suddenly slowed down in a shock wave that is approaching the ring.
|
|
|
Top: spectrum of Lyman-alpha line from SN1987A from
the Space Telescope Imaging Spectrometer. The streak indicated by the
blue arrow is emission by hydrogen gas moving toward us at a velocity
of 15,000 km/s inside the near (lower) side of the tilted circumstellar
ring, and the streak indicated by the red arrow, from gas moving away
from us.
|
In January 2000, we first used the Chandra X-ray telescope
to obtain the first image of the X-ray emission from SN1987A, showing that the
X-rays are coming from roughly the same region inside the ring that is emitting
the radio and ultraviolet line radiation. The results are shown below.
|
|
|
Shock interaction region inside the inner ring of SN1987A. (Courtesy
David Burrows, Penn State University). Red: HST optical image of the
inner circumstellar ring; Green: radio emission; Blue: X-ray emission
observed by Chandra.
|
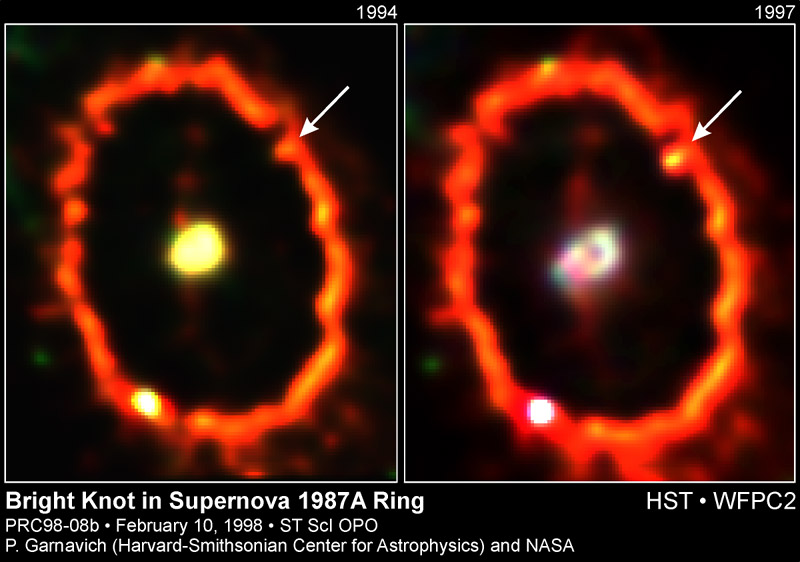
We also see a rapidly brightening "hot
spot" on the ring, evidently the spot where the supernova
blast is making first contact with the ring, as illustrated below.
|
|
|
The hot spot on the ring of SN1987A. In the 1994 image (left) we
see an inward protrusion at the location of the spot (indicated by the
arrow). In the 1997 image (right), the spot has brightened noticeably.
Note also that the radioactive supernova debris in the center of the
image has dimmed considerably during the three-year interval. See also
this movie and graph
showing the brightening of the hot spot.
|
All this action is summarized in this movie, which I made with the help of people at
the Space Telescope Science Institute. The first part shows the flash of the
supernova, and then the ring lighting up due to illumination by X-rays from
the supernova flash. We see the near side of the ring first because it is closer.
About 400 days after the initial flash, the whole ring was bright -- hundreds
of times brighter than it is today. This would have been a great show; but nobody
could see it. The HST hadn't been launched yet and no ground-based telescope
could see the ring at that time. The next segment of the movie shows the ring
fading over 10 years, while the invisible debris of the explosion races out
toward the ring. Then the first bright spot appears on the ring, as we see today.
Soon, several other spots will appear, growing and merging. Finally, 10 years
from now, the entire ring will become hundreds of times brighter than it is
today.
Check here for the details of a press conference that
I and my colleagues gave at NASA headquarters in 1998. But that's already old
news. Keep watching this page. This story will change fast!
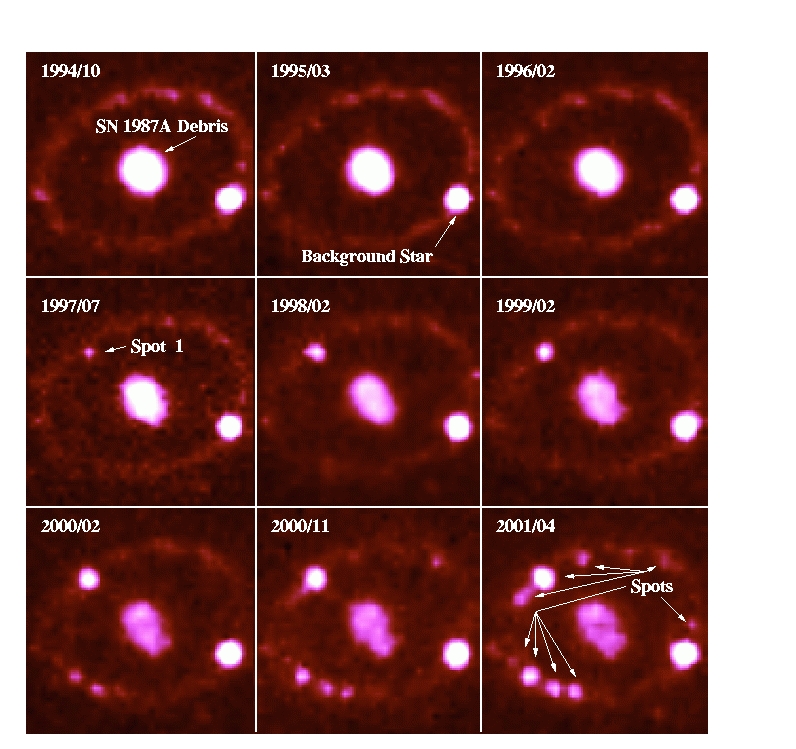
Update, February 20, 2002:
Just as we predicted, several other spots have appeared! The montage below shows
how the image of the ring has changed from October 1994 to April 2001. A "hot
spot" first appeared in the upper left quadrant of the ring in July 1997
and has continued to brighten ever since. We also see that several more rapidly
brightening spots have now appeared all around the ring. To read more about
these observations, check Onset
of Titanic Collision Lights up Supernova Ring from the
Space Telescope Science Institute.
One of the big unanswered questions is: just how hot are the hotspots?
A crucial observation to answer this question is to see if the spots are emitting
X-rays. But we couldn't tell from the X-ray image shown above. The image was
too noisy and uncertain because our Chandra observation of January 2000 was
too short. So, in summer 2000 we wrote a proposal to take two more X-ray image
with Chandra, these times with a much longer observation (about 28 hours)
that would record ten times as many X-ray photons as we recorded in the image
shown above. Those observations took place on December 2000 and December 2001,
and the results are shown below:
|
|
|
Chandra images of X-rays from SN1987A, taken on Dec.
2000 (left three) and Dec. 2001 (right pair). The top pair of images
represent the soft X-rays (from relatively cooler gas), while the contour
lines represent the optical image of the inner ring as seen by the Hubble
Space telescope. The middle pair of images represent the X-rays from
intermediate temperature gas, while the bottom pair represent the X-rays
from the hottest gas. The contour lines in the bottom pair represent
the radio image as seen by the Australia Telescope Compact Array. We
see that the X-ray emission brightened dramatically in one year. The
brightest parts of the soft X-ray images seem to coincide with the hotspots
seen in the Hubble Space Telescope image.
|
(Return
to course home page)
Last modified February 25, 2002
Copyright by Richard McCray