6. CLUSTERS OF GALAXIES:
Galaxies are not distributed uniformly throughout space --
most are clumped together in clusters and superclusters that are evidently held
together by gravity due to dark matter between the galaxies.
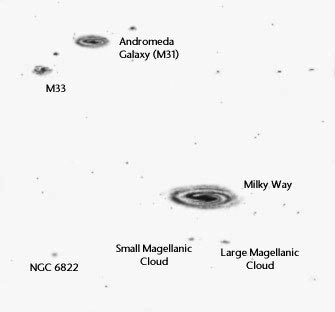
In fact, our own Milky Way galaxy belongs to a small cluster of
galaxies, called The Local Group,
which contains two large spiral galaxies (the Milky Way and M31), one medium-sized
spiral (M33) and more than 30 other galaxies, most of them irregular galaxies
much smaller than the Milky Way. For a complete listing and more details, see
The Local Group
of Galaxies.
|
|
The most massive galaxies of the Local Group
|
|
Galaxy
|
Distance (106 lt-years)
|
Mass (109 Suns)
|
|
Milky Way
|
---
|
1000
|
|
M31
|
2.5
|
1500
|
|
M33
|
2.7
|
25
|
|
LMC
|
0.16
|
20
|
|
SMC
|
0.19
|
6
|
|
The Local Group of galaxies. The figure (from Cyberia/Cosmos)
is about 4 million light years on a side.
|
|
|
|
|
|
The Andromeda Galaxy M31
and its two satellites, M32
and M110,
is almost a twin of the Milky Way.
|
M33,
the third largest galaxy in the local group.
|
The Small Magellanic Cloud (SMC).
The spherical object on the right is the globular cluster 47
Tucanae
|
The Large and Small Magellanic Clouds (LMC and SMC) are named
after the great explorer Ferdinand
Magellan, who recorded them during his journey around
the world in 1520. We can't say he discovered them because they are easily visible
to the naked eye. Magellan called them "noctilucent clouds." Today we know that
they orbit the Milky Way, and that they contain billions of young stars.
Within 30 million light years there are a few other groups of
galaxies similar to the local group, listed here.
GIANT CLUSTERS
The nearest giant cluster of galaxies is the Virgo
Cluster of galaxies. It contains more than 2,000 galaxies,
many of them larger than the Milky Way. The distance of the Virgo Cluster from
the Milky Way is still somewhat uncertain, but a good estimate is about 50 million
light years.
Astronomers have found thousands of clusters of galaxies. You
can find images of several in Galaxy
cluster mug shots from the University of Arizona.
|
|
|
The violet overlay on this optical image of a cluster of galaxies
represents X-ray emission from hot gas between the galaxies. Source.
|
Astronomers have discovered a very important fact about the
rich clusters of galaxies: they are powerful X-ray sources. The X-rays are emitted
by hot (temperature of a few millions of degrees) gas that fills the space between
the galaxies. Compare the optical and X-ray images of clusters in Galaxy
cluster mug shots. The mass of the X-ray emitting gas in a rich cluster
is comparable to the net mass in all the galaxies. But, as we shall see in the
next section, the clusters are held together by an even greater mass of "dark
matter".
Although about 80% of all large galaxies are spirals and 20%
are ellipticals, the proportions are reversed in rich clusters. We know two
reasons why this is so. First, the galaxies in rich clusters are all moving
through the hot intergalactic gas in the cluster at speeds of hundreds of kilometers
per second. This hot gas acts as a powerful wind blowing through the galaxy,
which will remove any gas produced by stars and supernovae. This hot wind prevents
the recycling of gas from stars to the disk of the galaxy that replenishes the
interstellar medium of spiral galaxies. The second reason is that galaxies in
rich clusters collide with each other, and galaxies that have suffered many
collisions tend to become elliptical in shape.
Superclusters: Most galaxies
do not reside in rich clusters like Virgo or Coma -- they reside in small groups
like the local group. But these groups are not uniformly distributed throughout
the universe. Instead, individual galaxies, small groups, and rich clusters
are distributed in a kind of "foamy" texture consisting of huge sheets and filaments
of galaxies separated by large "voids" where very few galaxies are found. The
typical diameters of the voids are 50 - 100 million light years. You can see
some of this texture below. But this map gives no information on the relative
distances of these galaxies.
|
|
|
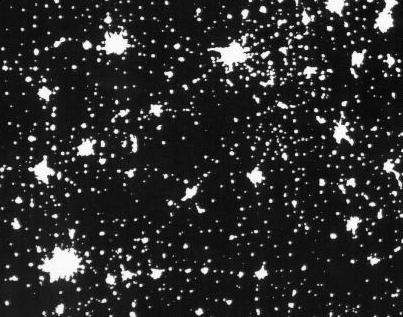
All-sky projection of the nearest 30,000 galaxies, within a distance
of about 1 billion light years. Few galaxies are seen in a band along
the equator, called the zone of avoidance,
where stars and dust in the Milky Way make it difficult to find galaxies.
The Coma Cluster is at top of the figure. The band of galaxies extending
from Coma to Hydra is the local supercluster, and that on the lower
left is the Perseus-Pisces supercluster.
|
|
|
|
This image is very similar to the real distribution of matter in
the universe - we see huge rich clusters, smaller clusters, little groups
like our own Local Group, and big voids with no galaxies in between.
But if you think that you are looking at the distribution of galaxies
in the universe, click on the image!
|
What astronomers really need is a 3-dimensional map of the universe
that shows not only the locations of the galaxies in the sky, but also their
distances. They can do that by taking spectra of thousands of galaxies and then
inferring their distances from the redshifts of their spectral lines and Hubble's
Law. Many groups of astronomers are conducting such redshift
surveys. They are huge efforts. Up to now, only a few strips
of the sky have been mapped in this way; but we can already see that they are
telling us something very important about the texture of the universe.
|
|
|
One of the most distant surveys of galaxies, the 2dF
Redshift Survey of nearly 100,000 galaxies (click on the
image to view full-size). In this depiction, the radial distance from
the center (the Milky Way) indicates redshift determined from the spectra
of the galaxies. According to Hubble's Law, the outer boundary (redshift
z = 0.3) corresponds to a distance of about 2.5 billion light years.
We see that the galaxies are not distributed uniformly, but have a "spongy"
texture, with the superclusters surrounding "voids" having characteristic
dimensions of about 100 million light years. Dark radial streaks occur
in directions where the observations have not yet been made.
|
For more details and images of about clusters and superclusters
of galaxies, see http://zebu.uoregon.edu/timages/toc3.html
|

|
|
The above movie (Source)
shows the density of galaxies moving outwards in increasingly distant
shells in redshift (shown on the counter). Dark colors show underdense
regions, bright colors are overdense.
|
Several other redshift surveys are underway to map the distribution
of galaxies in the universe. Another important one is the Las
Campanas Redshift Survey. The most ambitious one is
the Sloan Digital
Sky Survey, a new 2.5 meter telescope
at Apache Point, New Mexico especially designed to observe more than 100 million
galaxies and measure spectra of more than 1 million of them. Using this telescope
full-time, the project will take about a decade to complete.
(Return
to course home page)
Last modified March 20, 2002
Copyright by Richard McCray